Friday, February 8, 2013

More About GIS Data

Where does GIS data come from :

  • Existing data
  • Conversion from existing data
  • Creating new data
GIS data are gathered in many ways and some details about data sources are already mentioned in this blog and this is yet again describe the first few phases of GIS process and as we now know that GIS process include Capture, Modelling, Storage , Manipulation and Present are the most important tasks in GIS , 
When gathering data , conversion of old data plays a major role. but those old data are more likely to be in non-digitized form , for example paper maps etc , so how to digitize those data is a challenge.

Digitizing 
      1.  Manual Digitizing .
      2.  Automatic Digitizing.           

Manual Digitizing


Manual digitizing can be done using digitizing table or by on-screen capturing , 
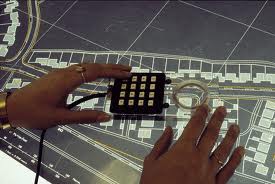
Digitizing table 


     First the map is position the map on the table , and then need to set the control points and minimum of 3 control points are needed to get accurate results.features of the map are captured by the cursor.
           

 On-Screen Capturing


GIS software enables this facility, first the map should be scanned and get to a computer , after that using a GIS Capturing software like Arc GIS we can screen capture the maps manually , and can store the digitized data layer by layer , like vegetation layer , buildings layer ... etc

Automatic Digitizing


Manual Digitizing is a vastly time consuming process so comparing to that Automatic method is easy and time saving.and there are scanners for these specialized purposes.in Automatic translation it convert raster to vector by tracing lines in the map and for this should use pattern recognition techniques and algorithms.


Coordinate Reference Systems


When we working on the points of the Earth's surface we need to pin point those locations accurately therefore we need a system to identify and mark those locations for us , and for this reason Coordinate systems are introduced to locate the points on the Earth Surface .Coordinate Reference System specify the locations on the surface of the earth .This uses the referenced data to get the coordinates of the location.
Most common types are Geographic Coordinate Reference Systems and Projected Coordinate Reference System.

Geographic Coordinate Reference Systems : this system uses a set of numbers to denote all the locations of the earth and it is a 3D model uses latitudes and longitudes to measure the location 


 Projected Coordinate Referenced Systems : Flat 2D coordiate system it's based on ( X,Y) points to locate the points on the Earth.It converts the Latituds and longitudes  to get these (X,Y) linear points .

few Examples :
Universal Transverse System ,
State Plane coordinate System. 

Map Projections

Map projections are used to represent the surface area of a solid object or a 3D object, and these map projections are used to create maps, and to make better visibility . There are few projection types which can be used to project the surface of the Earth . but in almost like every projection portion of actual surface data will be lost or will get distorted . 


Projection Types


  •  Cylindrical Projection
  •  Conical Projection. 
  •  Planer Projection. 
these Projection types are based on the flatten-able developing surface  onto which the earth is projected , for example if the earth surface is projected in to a Cylinder then the projection type is Cylindrical and developing surface is a cylinder.

Cylindrical Projection 


In Cylindrical projection the developing surface is a cylinder and it's the most common projection type to represent the earth.also the most common available World map is a cylindrical projection.for cylindrical projection earth is considered as a sphere and there are different types of cylindrical projections considering to the orientation of the cylinder for example 
if the orientation of the cylinder is parallel to the Earth's polar axis then it's called normal cylindrical Projection and when the orientation is perpendicular to the Earth's polar axis then it's called as the Transverse cylindrical projection  and if the orientation is between 0-90 degrees relative to the Earth's polar axis then it's the oblique Projection.

Conical Projection


In Conic projection the map is placed or projected in to a cone shaped screen.and this is considered to be more reliable than the cylindrical projection but the main problem is that it's more correct near the top part f the cone but when travel along to the bottom it get more and more distorted and results will be not accurate.and same as the cylindrical projection the projection type can be different from Normal , Transverse or Oblique depending on the orientation of the cone.


Planer Projection


in Planer Projection the developing screen or the surface is a plane .if the Earth is to be a prefect sphere then the planer projections will be more accurate but as we all know up to now Earth is not a perfect Sphere.and Planer projections are also used to get a part of the globe or a particular area only , so in this way it creates more accurate results .and  projection type can be different from Normal , Transverse or Oblique depending on the orientation of the plane.

and each of this Projection types have it's own advantages and disadvantages and the projection type is depend on the need of the map.

Wednesday, February 6, 2013

Earth Representing Methods

Earth Representing Methods 


Basic ways are Shepre, Ellipsoid/Spereroid  , Geoid , 

Representing Earth as a Sphere 

Earth is considered as a Sphere and it divided in to imaginary lines called parallels and meridians, and these imaginary lines are used to form Geographical coordinates Latitudes and longitudes, 


Latitudes 

(shown as a horizontal line) is the angular distance, in degrees, minutes, and seconds of a point north or south of the Equator. Lines of latitude are often referred to as parallels. Latitudes angles are measured in  
 north-south direction and it ranges between 0-90 , latitude lines separated the earth in to Northern ans southern hemispheres and by definition northern measurements considered to be positive and Southern measures are negative but this is not a standard.   


Longitudes 

(shown as a vertical line) is the angular distance, in degrees, minutes, and seconds, of a point east or west of the Prime (Greenwich) Meridian. Lines of longitude are often referred to as meridians. 
Longitudes are measured i East-West direction and the angle is ranges between 0-180 degrees, 
Longitudes separate the earth in to Eastern and Western hemispheres and same as the previous hemisphere western measurements are positive and eastern measurements are negative , 


Representing as an Ellipsoid / Spheroid

When technically looking at the shape of the earth , it's not a sound sphere , but it's more like a ellipse 
when by considering the earth as a ellipse flattering value is  important factor and flattering is gain by 


( semi Major axis - semi minor axis ) / semi minor axis 

* semi Major axis is the longest diameter and semi-minor axis is the short diameter 

Representing Earth as a Geoid

When considering the earth as an ellipse , actually the real shape is still slightly different than an ellipse , because there are seas and mountains and so many geo objects that changes the shape of the earths surface so to get these kind of a actual shaped earth we need to use a Geoid.


and when using  ellipsoids and Geoids it's hard to use the same ellipsoid for all the locations of the earth  , and as a solution for this introduced different ellipsoids for different locations 

Datum 

A datum is a mathematical model of the earth surface which helps to get the measurements and the coordinates of the earth.and in different parts of the earth and for various reasons there are so many datum which are most matching for the location and the purpose.
some datum examples are : North American Datum,Origin datum, ...etc

Tuesday, February 5, 2013

GIS basic operations 


When considering a GIS application  , there are various types of work to be done , in order to perform well those activities include 

  • Capture
  • Storage
  • Editing
  • Analysis
  • Visualization
  • Getting outputs 

Data Capturing 

There are various ways of getting data in to a GIS application for example data can be gain from Satellite images or aerial photographs  this is one the most accurate and reliable ways of getting data , and when creating a map of a certain area or a country aerial photographs plays a vital part

Another way to get data is by digitizing printed material using scanners or digitizing equipment , and there are such devices that first map the printed map to a coordinate system and then users can map the Geo objects one by one into the digitize form . 

Getting data from existing databases are also a great method of grabbing some useful data , and one drawback of this method is that data can be outdated. but still they can be useful.

Also users can get data by GPS systems , and this is not a fast and straight forward way in most cases this method is used to correct the gathered data or when there is uncertainties in aerial or satellite images , GPS systems can be used to correct it.


Storage

When storing GIS data it's recommended to use databases systems which have geodatabase capabilities 
so that the users can easily use those special facilities given from the database,  

Editing

after capturing and storing data , then the process start to edit the captured data , in every case captured data are have so many faults , and these faults needed to be corrected , and even for the accuracy those captured data must be rechecked for the correctness. and the time Geo data keep changing rapidly so have to monitor those changes and apply to the existing data.

Analyzing

Data analyzing is one of the main features of a GIS system and by analyzing Geo data , we can make many conclusions , Identify certain patters , rhythms , and importantly future predictions can be made by using those data, 

Analyzing methods 

  1. Buffered analysis 
  2. Spatial analysis 
  3. Spatial statistics 
Buffer analysis is used for identifying areas surrounding geographic features.The method includes  generating a buffer around existing geographic features and then identifying or selecting features based on whether they fall inside or outside the boundary of the buffer.

For example, in a Nuclear explosion GIS  system can mark a buffer around the affected areas to identify the most and least exposed areas and then 
can mark the evacuation areas.

Visualizing


Visualizing Geo data is a one of the main outputs of a GIS System, after doing all the hard work it's important to visualize gathered data and finding in a proper unfriendly way , and many users will only see this part of the project, so visualizing should be graphically  readable .